 |
 |
| 1 | |
|
|

|
Systems
|
P-TRAQ Pallet Tracking | ||||||||||
|
 |
P-TRAQ acts as a quintessential bridge between the P-DAQ and B-DAQ systems to track pallets from the moment of creation until the moment they are consumed. P-TRAQ was designed with both large and small companies in mind as it is customized to fit each individual company's unique requirements. From simple tracking of work in process product in small plants, to inter-continental / inter-warehouse tracking of product, all of your requirements can be handled by the system with ease. P-TRAQ provides users with a feature-rich, graphical, user friendly means to track "Work in Process" goods at the Country, State/Province, City, Plant, Warehouse, Zone, and the actual Rack & Bay location level. P-TRAQ provides users with the ability to locate existing pallets, to know where empty or full bays are in the warehouse, and which pallets are no longer required and need to be shredded. P-TRAQ facilitates the effecient storage of pallets. When a pallet is to be moved, the system will give the operator the location of the last pallet stored for the associated job. P-TRAQ tracks the creation date and last activity date of each pallet. Reports are provided to identify pallets which may no longer be needed in an effort to increase the usable space in your warehouse. P-TRAQ supports Inter-Warehouse Transfers. Pallets scanned for transfer to other locations will appear in the system in both locations as "In Transit" until scanned at the destination location P-TRAQ can communicate with your current systems to facilitate the exchange of vital information throughout your business. P-TRAQ collects and reports on data that management has been asking for, but was previously too costly and time-consuming to acquire. INTERFACES:
|
|||||||||
-------------------------------------------------------------------------------------------------------------------------------------------------
|
|
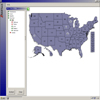
This is the P-TRAQ Main-screeen. On the right, the Map View is dynamically linked to other locations and is used to zoom in to get a close up view. The image to the right shows a map of the United States. Users can create their own links on the screen to denote multiple plant locations in a given country, or world-wide if applicable using the maintenance tool. |
|
|
|
This map is a representation of the state of Wisconsin. This map was displayed after the user clicked the "Wisconsin" link from the USA map. Users can add thier own links on the screen to denote multiple plant locations if applicable using the maintenance tool. |
|
|
|
This map is a scaled representation of the entire facility. This facility level map is displayed upon clicking the link from the Wisconsin map. In this example, the user queried Availability in the plant. The green dots on the report denote the location of full or partially full bays. The white space denotes empty bays. Clicking in one of the full bays will produce a report of which pallets are stored there as well. |
|
|
|
This map is a scaled representation of one of the warehouses. Users can create their own racks on this screen to denote rack locations using the maintenance tool. This map was linked to using one of the links on the plant map. All of the racks are drawn to scale automatically as per the dimentions of your plant. In this example, the user queried a given job. The blue dots on the report denote the location of the job's pallets. A report of these locations will also be provided.
|
|
|
|
This
map is a representation of a given rack. This map was linked to dynamically
after the user clicked one of the rack links in the warehouse.
In this example, the user queried pallets older than 90 days. Clicking in one of the full bays will produce a report of which pallets are stored there as well. |
|
|
|
This example displays which bays need to be manually counted for bay maintenance. |


-------------------------------------------------------------------------------------------------------------------------------------------------
|
|
Using the Tree View on the left side of the screen, users can inquire about the location of pallets for a given job, or the location of empty space troughout the plant. The nodes in the tree are dynamically linked to the hot-spots on the Map View. As you view various locations throughout the plant, the Tree View keeps track of where you are.
|
--------------------------------------------------------------------------------------------------------------------------------------------------
|
|
Reports
are used to access the vast amount of data accumulated by the system.
Reports can be viewed or printed based on specified selection criteria.
Once the report is displayed, it may be printed selectively or in
its entirety. The system currently contains 7 reports: The
following shows and explains some of the reports in more detail and
displays some of the charts provided: |
| © Copyright 2003 - 2013 NASTech, Inc | |||||