 |
 |
| 1 | |
|
|
|
Systems
|
B-DAQ Bindery Management System | ||||||||||
|
 |
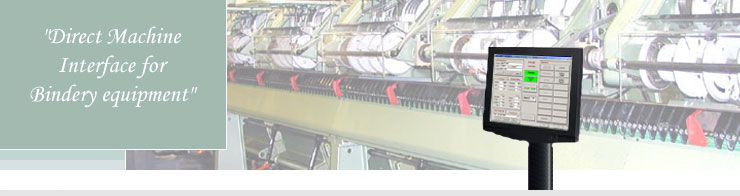
B-DAQ (bee' dak) has been developed with the same structure, database and reports as it's big brother P-DAQ. Having the same back-end ensures that all of your systems can be managed cohesively. B-DAQ was developed to interface to perfect binding equipment and bindery stitchers. B-DAQ collects information with as little user input as possible, which frees the operator up to concentrate on their primary job, producing quality work for your business. B-DAQ consists of four primary modules, (click the links to the left for more information about each module) all operating together to provide the highest level of real-time data possible without compromising the fail-safe requirements of the system. Using our unique Bi-directional Data Synchronization Technology (BDST), the local and remote databases are continuously synchronized. B-DAQ monitors gross and net books, estimated time remaining, machine performance, pallet production data and much more all at the touch of a screen. B-DAQ can communicate with your current systems to facilitate the exchange of vital information throughout your business. B-DAQ can reduce the time spent in reporting labor and pallet information to other systems. A complete set of reports give users the information they need for trouble-shooting problems and analyzing productivity and performance. B-DAQ allows plant managers, scheduling personnel, and customer service representatives to monitor the current status of jobs from anywhere on the network with up to the minute data fed directly from the bindery. B-DAQ collects and reports on data that print management has been asking for, but was previously too costly and time-consuming to acquire. KEY BENEFITS:
|
|||||||||
-------------------------------------------------------------------------------------------------------------------------------------------------
|
|
The Bindery Module collects real-time data from each machine. The machine is linked to the B-DAQ computer via the Bindery Interface Module (BIM). The operator records labor and down-time reason codes. The main window for B-DAQ is extremely user friendly, simplified for its intended use on less complex machinery. The operator interface is divided into three sections. The left section contains information pertaining to the job/version running, the overall job and current version status with associated run time and spoilage statistics. The statistics are continually updated while the machine is running. The current and next shift operators are also defined. The center section contains real-time machine status information and buttons to control the various functions of the system. The right section contains a series of buttons defining the various operation codes that pertain to the machine and the current status of the job. |

-------------------------------------------------------------------------------------------------------------------------------------------------
|
|
The Scheduling Module is used to define or view the requirements of scheduled jobs prior to going to the bindery. Entering jobs here and not at the machine, simplifies the flow of work to the bindery, and allows operators to focus on the operation of the machine. At the machine, jobs are selected simply with a touch of a screen. The
flexibility of the system enables jobs to be loaded from in-house
scheduling systems. Once loaded, jobs can be easily moved from machine to machine and can easily be re-ordered when priorities change. |

-------------------------------------------------------------------------------------------------------------------------------------------------
|
|
The Bindery Status Module is used by customer service, scheduling and management personnel to determine the current status of jobs in the bindery. The folder tabs represent the machines which may be viewed. Once selected, the current status is displayed.The status is then updated approximately every 15 seconds. Time remaining is calculated and displayed based on current and average machine speeds.The time remaining based on the average speed is valuable if the machine is down. Taking
advantage of the latest technology, the Bindery Status Module also allows
management and/or your customers to view job status information from
virtually anywhere in the world via the internet. |
|
|
|
Using the Status Summary screen, the status of all of your machines may be viewed simultaneously. This allows you to view the status of the entire bindery at a glance. |


-------------------------------------------------------------------------------------------------------------------------------------------------
|
|
The Reporting
Module is
used by management to access the vast amount of data accumulated
by the system. Reports can be viewed or printed based on specified
selection criteria. Once the report is displayed, it may be printed
selectively or in its entirety. The reporting system provides a
valuable tool for cutting costs and for evaluating machine and crew
performance. The system currently contains more than 15 reports. They are grouped as follows:
The
following shows and explains some of the reports in more detail and
displays some of the charts provided: |
|
|
|
The Bindery Statistics (Weekly) Report shows Bindery statistical information summarized by week for a specified period. The statistical detail for the charted data is provided on a separate page. The charts produced are as follows:
|
|
|
|
The Production Analysis Report is used to view detailed statistics for each machine including gross count, good count, makeready, run and downtime statistics. |
|
|
|
The
Stop Analysis Reports are used to analyze machine stops based on
several different criteria. While measuring down-time and waste is important,
the main objective should be to reduce waste. These reports provide an
invaluable tool for waste reduction. Several charts are produced which
rank the reasons for the stops as follows:(Click
image to enlarge.) Top 10 causes based on stop frequency. Top 10 causes based on down-time hours. Top 10 causes based on aggregate cost. |
|
|
|
The Run Chart charts books per hour over a specified period of time and provides operator and downtime reason codes. |


| © Copyright 2003 - 2013 NASTech, Inc | |||||